
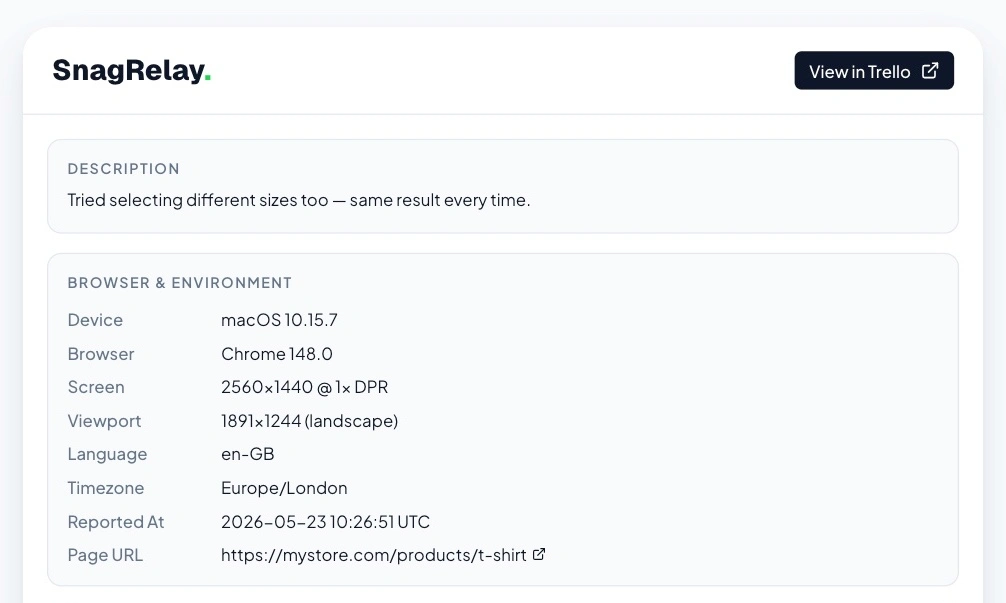
What every report includes
Console errors and warnings, the full network request and response bodies for every API call at bug time, JS error stack traces with component and line number, and a complete browser environment snapshot — browser version, OS, screen size, viewport, URL, and any user identity you pass via api.init().
Custom metadata
Pass additional context through api.init() — feature flags, A/B test variants, subscription tier, account ID, or anything else your team finds useful when investigating bugs.
<script>
  window.onSnagRelayLoad = function(api) {
    api.init({
      user: { id: '123', email: 'user@example.com', plan: 'pro' },
      meta: { featureFlag: 'checkout-v2', experiment: 'variant-b' }
    });
  };
  var script = document.createElement('script');
  script.defer = 1;
  script.src = 'https://app.snagrelay.com/widget/load/YOUR_API_KEY?onload=onSnagRelayLoad';
  document.getElementsByTagName('head')[0].appendChild(script);
</script>